PLEASE NOTE

This is PAGE SIX of Brett's Portfolio Report and History
and covers the period from 22nd January 2009 to 27th February 2009

CLICK HERE to go to PAGE ONE
31st July 2008 to 18th September 2008
CLICK HERE to go to PAGE TWO
19th September 2008 to 13th October 2008
CLICK HERE to go to PAGE THREE
14th October 2008 to 13th November 2008
CLICK HERE to go to PAGE FOUR
14th November 2008 to 9th December 2008
CLICK HERE to go to PAGE FIVE
10th December 2008 to 21st January 2009
CLICK HERE to go to PAGE SEVEN
28th February 2009 to 3rd April 2009
CLICK HERE to go to PAGE EIGHT
4th April 2009 to 19th April 2009
CLICK HERE to go to PAGE NINE
20th April 2009 onwards


"Brett's Investments"


!!! NEW..PORTFOLIO !!!

NOTE ... these details are now listed on PAGE NINE

************************************************************************************

"Dividends Received"

NOTE ... these details are now listed on PAGE NINE

************************************************************************************

"Performance"

NOTE ... these details are now listed on PAGE NINE

************************************************************************************

Thursday 22nd January 2009
trading days since initial portfolio was set up on 31st July 2008 = 123
trading days since portfolio was changed on 14th October 2008 = 70
COST OF THIS PORTFOLIO = $57973.84
TARGET PORTFOLIO VALUE =
$65554.64 = the total amount Brett has invested since 31st July 2008 and this
amount includes all shares from dividend reinvestment plans and also the investing of $430.41 received as cash dividends

OZL - in trading halt until Friday 27th February 2009 - click here for all details and reports

============================================================================================================

Friday 23rd January 2009
trading days since initial portfolio was set up on 31st July 2008 = 124
trading days since portfolio was changed on 14th October 2008 = 71
COST OF THIS PORTFOLIO = $57973.84
TARGET PORTFOLIO VALUE =
$65554.64 = the total amount Brett has invested since 31st July 2008 and this
amount includes all shares from dividend reinvestment plans and also the investing of $430.41 received as cash dividends

OZL - in trading halt until Friday 27th February 2009 - click here for all details and reports
TOTAL - on Wednesday 7th January 2009 the total reached $42345.95 and this was the highest total since Monday 10th November 2008 - today the total is $37239.72 - and that is a fall of $5106.23 in the last twelve trading days
BHP - finished today's trading at $27.45 per share and that is it's lowest price since Monday 8th December 2008
Aussie stocks drop on dark trading day

The Australian share market closed down by just over four cent to a near five-year low as bank and resource stocks were weighted down by continuing concern about the health of the global economy
At the close on Friday, the benchmark S&P/ASX200 index was down 144.1 points, or 4.13 per cent, at 3,3342.7 - its lowest close since February 2004 when the index finished at 3,333.7
The broader All Ordinaries index fell 131.6 points, or 3.83 per cent, to 3,300.3 - its lowest close since late January 2004 when the index closed at 3283.6
Analysts said continuing unease over the health of overseas banks weighed on local banks and the resources sector was hit heavily by concerns over the slowdown in Australia's major export partners - Japan, China and South Korea as well as lower base metal prices
CMC Markets analyst David Taylor said local trading started poorly on Friday following a negative lead from United States markets and more bad news on the US economy
"Again, the economic numbers out of the US last night - housing figures and jobless figures - were all disappointing" Mr Taylor said
"We've got more bad news out of their banking sector The banks were sold off last night, and that's flowed on to our market Base metals prices were down Just about everything that could have been down was down, in terms of what effects our market"
On Wall Street overnight, the Dow Jones Industrial Average index fell 105.3 points, or 1.28 per cent, to 8,122.8
Here, in the resources sector, global miner BHP Billiton fell $1.69, or 5.8 per cent, to $27.45 while rival Rio Tinto dumped 74 cents to $38.06
Among the major banks, Commonwealth Bank of Australia was $1.53, or 5.98 per cent, lower at $24.07 as the bank suffered an acceleration of outflows in its funds under management during the December quarter
National Australia Bank was off $1.17, or 6.46 per cent, at $16.94; ANZ Bank declined 94 cents, or 7.23 per cent, to $12.06; and Westpac lost 92 cents, or 5.93 per cent, to $14.60
The price of gold in Sydney was $US856.80 per fine ounce, up $US3.90 on yesterday's close of $852.90
In the gold sector, Newmont was 14 cents higher at $6.18, Newcrest sagged $1.33 to $30.57 and Lihir Gold slipped three cents to $2.92
x
Australian stocks hit a five-year low
The local banks crashed to lows not seen for more than six years
In a day of carnage in the banking sector, National Australia Bank hit a 12-year low with a $1.17, 6.5 per cent slide to $16.94
Other banks also hit record lows - ANZ Bank its worst for nine years, Westpac and the Commonwealth Bank their worst for six years - on fears about the global economy and the banking sector worldwide
The rout sent the S&P/ASX 200 index yesterday crashing 4.2 per cent to 3342.7 points, a five-year low, as investors digested confirmation that the global economy was collapsing into recession
The All Ordinaries was down 131.6 points at 3300.3
The market has now more than halved since its record high struck in November 2007, wiping about $900 billion off the value of shares
Stocks have lost 5.9 per cent this week alone, led by the banking sector
ANZ Bank fell 7.2 per cent to $12.06 yesterday, while Westpac shed 5.9 per cent to $14.60 and Commonwealth Bank gave up 6 per cent to $24.07
Macquarie Group, the nation's biggest home-grown investment bank, fell $1.05 to $24.55
ANZ Bank suffered the steepest loss of all the banks this week, falling 15.7 per cent
x
Babcock shares worthless as banks bleed
Elsewhere in the financial sector, Babcock and Brown Ltd remained in a trading halt after it said there would be nothing left for shareholders after its lenders take their cut under a plan the debt-laden investment firm is discussing with its bankers
Babcock and Brown last traded at 32.5 cents

============================================================================================================

Tuesday 27th January 2009
trading days since initial portfolio was set up on 31st July 2008 = 125
trading days since portfolio was changed on 14th October 2008 = 72
COST OF THIS PORTFOLIO = $57973.84
TARGET PORTFOLIO VALUE =
$65554.64 = the total amount Brett has invested since 31st July 2008 and this
amount includes all shares from dividend reinvestment plans and also the investing of $430.41 received as cash dividends

OZL - in trading halt until Friday 27th February 2009 - click here for all details and reports


x

============================================================================================================

Wednesday 28th January 2009
trading days since initial portfolio was set up on 31st July 2008 = 126
trading days since portfolio was changed on 14th October 2008 = 73
COST OF THIS PORTFOLIO = $57973.84
TARGET PORTFOLIO VALUE =
$65554.64 = the total amount Brett has invested since 31st July 2008 and this
amount includes all shares from dividend reinvestment plans and also the investing of $430.41 received as cash dividends

OZL - in trading halt until Friday 27th February 2009 - click here for all details and reports
TOTAL - has jumped by $2889.32 in the last two trading days !!

============================================================================================================

Thursday 29th January 2009
trading days since initial portfolio was set up on 31st July 2008 = 127
trading days since portfolio was changed on 14th October 2008 = 74
COST OF THIS PORTFOLIO = $57973.84
TARGET PORTFOLIO VALUE =
$65554.64 = the total amount Brett has invested since 31st July 2008 and this
amount includes all shares from dividend reinvestment plans and also the investing of $430.41 received as cash dividends

OZL - in trading halt until Friday 27th February 2009 - click here for all details and reports
TOTAL - has jumped by $3369.56 in the last three trading days !!
TOTAL - $40600.62 is the highest total since Monday 12th January 2009 - and that is a period of twelve trading days !!

============================================================================================================

Friday 30th January 2009
trading days since initial portfolio was set up on 31st July 2008 = 128
trading days since portfolio was changed on 14th October 2008 = 75
COST OF THIS PORTFOLIO = $57973.84
TARGET PORTFOLIO VALUE =
$65554.64 = the total amount Brett has invested since 31st July 2008 and this
amount includes all shares from dividend reinvestment plans and also the investing of $430.41 received as cash dividends

OZL - in trading halt until Friday 27th February 2009 - click here for all details and reports


x

============================================================================================================

Monday 2nd February 2009
trading days since initial portfolio was set up on 31st July 2008 = 129
trading days since portfolio was changed on 14th October 2008 = 76
COST OF THIS PORTFOLIO = $57973.84
TARGET PORTFOLIO VALUE =
$65554.64 = the total amount Brett has invested since 31st July 2008 and this
amount includes all shares from dividend reinvestment plans and also the investing of $430.41 received as cash dividends

OZL - in trading halt until Friday 27th February 2009 - click here for all details and reports

============================================================================================================

Tuesday 3rd February 2009
trading days since initial portfolio was set up on 31st July 2008 = 130
trading days since portfolio was changed on 14th October 2008 = 77
COST OF THIS PORTFOLIO = $57973.84
TARGET PORTFOLIO VALUE =
$65554.64 = the total amount Brett has invested since 31st July 2008 and this
amount includes all shares from dividend reinvestment plans and also the investing of $430.41 received as cash dividends

OZL - in trading halt until Friday 27th February 2009 - click here for all details and reports

============================================================================================================

Wednesday 4th February 2009
trading days since initial portfolio was set up on 31st July 2008 = 131
trading days since portfolio was changed on 14th October 2008 = 78
COST OF THIS PORTFOLIO = $57973.84
TARGET PORTFOLIO VALUE =
$65554.64 = the total amount Brett has invested since 31st July 2008 and this
amount includes all shares from dividend reinvestment plans and also the investing of $430.41 received as cash dividends

OZL - in trading halt until Friday 27th February 2009 - click here for all details and reports
TOTAL - has dropped by $2231.28 in the last four trading days !!

Panoramic Resources Limited
six months chart

Stocks close lower
The Australian share market closed strongly in the red, weighed down by the property trust and mining sectors
The benchmark S&P/ASX200 index was down 70.8 points, or 2.02 per cent, at 3,437.9, while the broader All Ordinaries index had shed 66.8 points, or 1.94 per cent, to 3,382.3
CommSec market analyst Juliette Saly said selling was heavier than expected, with Westfield Group and Macquarie Group among the worst performers
Shares in Macquarie Group were down $1.86, or 7.52 per cent, at $22.87 while Westfield had given up $1.50, or 12.4 per cent, to $10.60 (NOTE - Brett sold his Macquarie Group shares on 18th September 2008 at $26.44 each)
"Investors are probably a little bit confused at the moment and are trying to mull through a lot of the earnings results" Ms Saly said
"We also keep hearing news of capital raisings every five minutes ... Qantas, Lend Lease and Westfield yesterday The fact Westfield had to raise almost $3 billion is really weighing on the market"
Shares in BHP Billiton inched one cent lower to $29.77 after the mining giant posted a 57 per cent drop in interim net profit to $US2.617 billion ($A4.03 billion)
"BHP has had a volatile day after results that were weaker than expected" Ms Saly said
"With the fact that chief executive Marius Kloppers is forecasting long-term demand for commodities will be good and the fact BHP is still in a very financially sound position, we did see it up two per cent at one point but it was sold off heading into market close"
The world's biggest miner - which had already flagged big asset write-downs - also warned that demand for its products was contracting while weakness and volatility in commodity prices were set to persist
Rival Rio Tinto had retreated $1.28, or 2.81 per cent, to $44.25
Ms Saly said the Reserve Bank of Australia's 100 basis point interest rate cut on Tuesday had been factored in to the market
Commonwealth Bank and National Australia Bank on Wednesday joined Westpac and ANZ Bank in passing on the rate cut in full to their customers on standard variable mortgages
Commonwealth Bank gained 13 cents to $29.18, National Australia Bank fell 10 cents to $19.45, Westpac was up seven cents to $16.47 and ANZ Bank lost 42 cents to $13.28
The spot price of gold in Sydney was $US897.10 per fine ounce, down $US4.60 on Tuesday's closing price of $US901.70
Gold stocks were weaker and Lihir Gold backtracked 10 cents, or 3.25 per cent, to $2.98, Newcrest Mining was down 70 cents, or 2.33 per cent, at $29.30 and Newmont Mining gave up 22 cents, or 3.52 per cent, to $6.03


============================================================================================================

Thursday 5th February 2009
trading days since initial portfolio was set up on 31st July 2008 = 132
trading days since portfolio was changed on 14th October 2008 = 79
COST OF THIS PORTFOLIO = $57973.84
TARGET PORTFOLIO VALUE =
$65554.64 = the total amount Brett has invested since 31st July 2008 and this
amount includes all shares from dividend reinvestment plans and also the investing of $430.41 received as cash dividends

OZL - in trading halt until Friday 27th February 2009 - click here for all details and reports

============================================================================================================

Friday 6th February 2009
trading days since initial portfolio was set up on 31st July 2008 = 133
trading days since portfolio was changed on 14th October 2008 = 80
COST OF THIS PORTFOLIO = $57973.84
TARGET PORTFOLIO VALUE =
$65554.64 = the total amount Brett has invested since 31st July 2008 and this
amount includes all shares from dividend reinvestment plans and also the investing of $430.41 received as cash dividends

OZL - in trading halt until Friday 27th February 2009 - click here for all details and reports

Lihir Gold Limited
twelve months chart


x

============================================================================================================

Monday 9th February 2009
trading days since initial portfolio was set up on 31st July 2008 = 134
trading days since portfolio was changed on 14th October 2008 = 81
COST OF THIS PORTFOLIO = $57973.84
TARGET PORTFOLIO VALUE =
$65554.64 = the total amount Brett has invested since 31st July 2008 and this
amount includes all shares from dividend reinvestment plans and also the investing of $430.41 received as cash dividends

OZL - in trading halt until Friday 27th February 2009 - click here for all details and reports

============================================================================================================

Tuesday 10th February 2009
trading days since initial portfolio was set up on 31st July 2008 = 135
trading days since portfolio was changed on 14th October 2008 = 82
COST OF THIS PORTFOLIO = $57973.84
TARGET PORTFOLIO VALUE =
$65554.64 = the total amount Brett has invested since 31st July 2008 and this
amount includes all shares from dividend reinvestment plans and also the investing of $430.41 received as cash dividends

OZL - in trading halt until Friday 27th February 2009 - click here for all details and reports

============================================================================================================

Wednesday 11th February 2009
trading days since initial portfolio was set up on 31st July 2008 = 136
trading days since portfolio was changed on 14th October 2008 = 83
COST OF THIS PORTFOLIO = $57973.84
TARGET PORTFOLIO VALUE =
$65554.64 = the total amount Brett has invested since 31st July 2008 and this
amount includes all shares from dividend reinvestment plans and also the investing of $430.41 received as cash dividends

OZL - in trading halt until Friday 27th February 2009 - click here for all details and reports

============================================================================================================

Thursday 12th February 2009
trading days since initial portfolio was set up on 31st July 2008 = 137
trading days since portfolio was changed on 14th October 2008 = 84
COST OF THIS PORTFOLIO = $57973.84
TARGET PORTFOLIO VALUE =
$65554.64 = the total amount Brett has invested since 31st July 2008 and this
amount includes all shares from dividend reinvestment plans and also the investing of $430.41 received as cash dividends

OZL - in trading halt until Friday 27th February 2009 - click here for all details and reports
ANZ - lowest price since purchase

ANZ Bank Limited
twelve months chart

ANZ Bank Limited
two year chart

x

============================================================================================================

Friday 13th February 2009
trading days since initial portfolio was set up on 31st July 2008 = 138
trading days since portfolio was changed on 14th October 2008 = 85
COST OF THIS PORTFOLIO = $57973.84
TARGET PORTFOLIO VALUE =
$65554.64 = the total amount Brett has invested since 31st July 2008 and this
amount includes all shares from dividend reinvestment plans and also the investing of $430.41 received as cash dividends

OZL - in trading halt until Friday 27th February 2009 - click here for all details and reports
TOTAL - is at $40346.89 and this is the highest since Friday 30th January, a period of ten trading days !!

Lihir Gold Limited
six months chart

x

============================================================================================================

Monday 16th February 2009
trading days since initial portfolio was set up on 31st July 2008 = 139
trading days since portfolio was changed on 14th October 2008 = 86
COST OF THIS PORTFOLIO = $57973.84
TARGET PORTFOLIO VALUE =
$65554.64 = the total amount Brett has invested since 31st July 2008 and this
amount includes all shares from dividend reinvestment plans and also the investing of $430.41 received as cash dividends

x
------------------

OZL - in trading halt until Friday 27th February 2009
OZL - UPDATE - "OZ Minerals wishes to advise that suspension of trading in the Company’s shares will be lifted by the ASX tomorrow, Tuesday 17 February, 2009" - click here for all details and reports


============================================================================================================

Tuesday 17th February 2009
trading days since initial portfolio was set up on 31st July 2008 = 140
trading days since portfolio was changed on 14th October 2008 = 87
COST OF THIS PORTFOLIO = $57973.84
TARGET PORTFOLIO VALUE =
$65554.64 = the total amount Brett has invested since 31st July 2008 and this
amount includes all shares from dividend reinvestment plans and also the investing of $430.41 received as cash dividends

============================================================================================================

Wednesday 18th February 2009
trading days since initial portfolio was set up on 31st July 2008 = 141
trading days since portfolio was changed on 14th October 2008 = 88
COST OF THIS PORTFOLIO = $57973.84
TARGET PORTFOLIO VALUE =
$65554.64 = the total amount Brett has invested since 31st July 2008 and this
amount includes all shares from dividend reinvestment plans and also the investing of $430.41 received as cash dividends

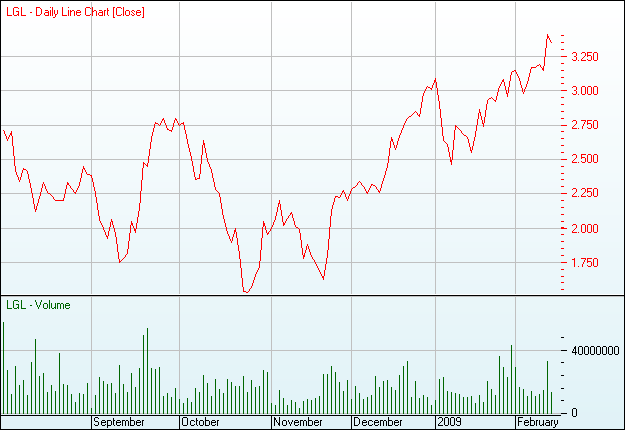
LGL - highest price since purchase

Lihir Gold Limited
twelve months chart


x

============================================================================================================

Thursday 19th February 2009
trading days since initial portfolio was set up on 31st July 2008 = 142
trading days since portfolio was changed on 14th October 2008 = 89
COST OF THIS PORTFOLIO = $57973.84
TARGET PORTFOLIO VALUE =
$65554.64 = the total amount Brett has invested since 31st July 2008 and this
amount includes all shares from dividend reinvestment plans and also the investing of $430.41 received as cash dividends

OZL - following the trading halt ...... it is now at it's highest price since 18th November 2008

OZ Minerals Limited
twelve months chart


x

============================================================================================================

Friday 20th February 2009
trading days since initial portfolio was set up on 31st July 2008 = 143
trading days since portfolio was changed on 14th October 2008 = 90
COST OF THIS PORTFOLIO = $57973.84
TARGET PORTFOLIO VALUE =
$65554.64 = the total amount Brett has invested since 31st July 2008 and this
amount includes all shares from dividend reinvestment plans and also the investing of $430.41 received as cash dividends

============================================================================================================

Monday 23rd February 2009
trading days since initial portfolio was set up on 31st July 2008 = 144
trading days since portfolio was changed on 14th October 2008 = 91
COST OF THIS PORTFOLIO = $57973.84
TARGET PORTFOLIO VALUE =
$65554.64 = the total amount Brett has invested since 31st July 2008 and this
amount includes all shares from dividend reinvestment plans and also the investing of $430.41 received as cash dividends

OZL - update on sale to Minmetals - click here and scroll down to Monday 23rd February 2009
PAN
- purchased on Thursday 31st July 2008 at $2.39 per share - the price dropped but on Wednesday 7th January 2009, they reached $1.40 each and this had been its highest price since the 1st October 2008 - today they are at their lowest price since purchase at just $0.745 per share !!
PAN - lowest price since purchase

Panoramic Resources Limited
twelve months chart


x

============================================================================================================

Tuesday 24th February 2009
trading days since initial portfolio was set up on 31st July 2008 = 145
trading days since portfolio was changed on 14th October 2008 = 92
COST OF THIS PORTFOLIO = $57973.84
TARGET PORTFOLIO VALUE =
$65554.64 = the total amount Brett has invested since 31st July 2008 and this
amount includes all shares from dividend reinvestment plans and also the investing of $430.41 received as cash dividends

============================================================================================================

Wednesday 25th February 2009
trading days since initial portfolio was set up on 31st July 2008 = 146
trading days since portfolio was changed on 14th October 2008 = 93
COST OF THIS PORTFOLIO = $57973.84
TARGET PORTFOLIO VALUE =
$65554.64 = the total amount Brett has invested since 31st July 2008 and this
amount includes all shares from dividend reinvestment plans and also the investing of $430.41 received as cash dividends

OZL - the shares today finished at a record low of just $0.495 and this is despite a takeover over offer at a share price of $0.825 !! - click here and scroll down to Thursday 26th February 2009 for all the details and reports - before today, the lowest price had been $0.52 per share on the 24th November 2008
OZL - lowest price since purchase

OZL Minerals Limited
twelve months chart

x

============================================================================================================

Thursday 26th February 2009
trading days since initial portfolio was set up on 31st July 2008 = 147
trading days since portfolio was changed on 14th October 2008 = 94
COST OF THIS PORTFOLIO = $57973.84
TARGET PORTFOLIO VALUE =
$65554.64 = the total amount Brett has invested since 31st July 2008 and this
amount includes all shares from dividend reinvestment plans and also the investing of $430.41 received as cash dividends

============================================================================================================

Friday 27th February 2009
trading days since initial portfolio was set up on 31st July 2008 = 148
trading days since portfolio was changed on 14th October 2008 = 95
COST OF THIS PORTFOLIO = $57973.84
TARGET PORTFOLIO VALUE =
$65554.64 = the total amount Brett has invested since 31st July 2008 and this
amount includes all shares from dividend reinvestment plans and also the investing of $430.41 received as cash dividends

PAN - in trading halt until Tuesday 3rd March 2009 - this was requested by Panoramic Resources due to an expected aquisition - the halt could end earlier if the announcement of the aquisition is released - which it has been !!
---------------------click here - request for halt from Panoramic Resources
---------------------click here - statement from the Australian Stock Exchange
---------------------click here - details on the aquisition - Brilliant Mining Corporation
TOTAL - is at $40743.99 and this is the highest since Monday 12th January 2009, a period of thirty-three trading days !!
WOR - finished today at $15.95 per share and this is it's highest price since Wednesday 7th January 2009 - on that day it finished at $16.00, which was it's highest price since Thursday 6th November 2008 !!

Worley Parsons Limited
six months chart

x

************************************************************************************

"Highs" and "Lows"

NOTE ... these details are now listed on PAGE NINE


PLEASE NOTE

This is PAGE SIX of Brett's Portfolio Report and History
and covers the period from 22nd January 2009 to 27th February 2009

CLICK HERE to go to PAGE ONE
31st July 2008 to 18th September 2008
CLICK HERE to go to PAGE TWO
19th September 2008 to 13th October 2008
CLICK HERE to go to PAGE THREE
14th October 2008 to 13th November 2008
CLICK HERE to go to PAGE FOUR
14th November 2008 to 9th December 2008
CLICK HERE to go to PAGE FIVE
10th December 2008 to 21st January 2009
CLICK HERE to go to PAGE SEVEN
28th February 2009 to 3rd April 2009
CLICK HERE to go to PAGE EIGHT
4th April 2009 to 19th April 2009
CLICK HERE to go to PAGE NINE
20th April 2009 onwards